SEC595: Applied Data Science and AI/Machine Learning for Cybersecurity Professionals


Experience SANS training through course previews.
Learn MoreLet us help.
Contact usBecome a member for instant access to our free resources.
Sign UpWe're here to help.
Contact UsIn part two of this mini-series on benchmarks for assessing your phishing program, we cover tiering and introduce the SANS Tiering Model.
In my most recent blog, I introduced the concept of benchmarking in your phishing programs, the importance of selecting the correct metrics to track, and how they relate to your position on your organization’s maturity model. Part II of this Benchmarking series will address Tiering, which allows for a more valuable assessment of your simulation data analysis, or an “apples to apples” comparison. The tiering concept includes difficulty of the phish, how many indicators, and how hard are they to identify and recognize as a phish.
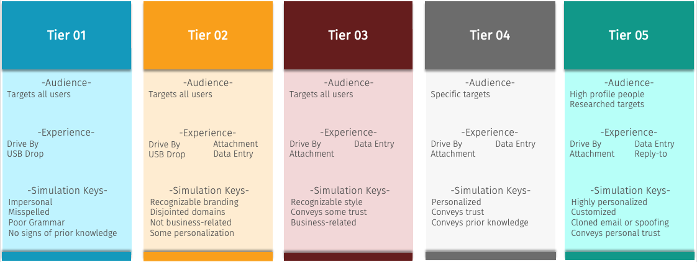
The SANS tiering model includes 5 levels identified below. Each tier has 3 specific areas: audience, experience, and simulation keys. While the audience and experience might vary tier to tier, the simulation keys are what truly separates the tiers. As you can see from the diagram below, a tier 1 simulation would be very “spammy” in nature, easy to recognize as a phish and impersonal. As you move up in the tiering, the indicators are more difficult to spot with brands or memo styling the workforce may be familiar with. This could be a non-business-related shipping notice in the tier 2 block, or a Zoom business related simulation within tier 3.
Tier 4 includes personalization and some trust and prior knowledge, such a program status. Tier 5 is very personalized, for highly targeted individuals and executive leaders. These assessments require additional resources and typically are separate events outside most simulation schedules and benchmark data.

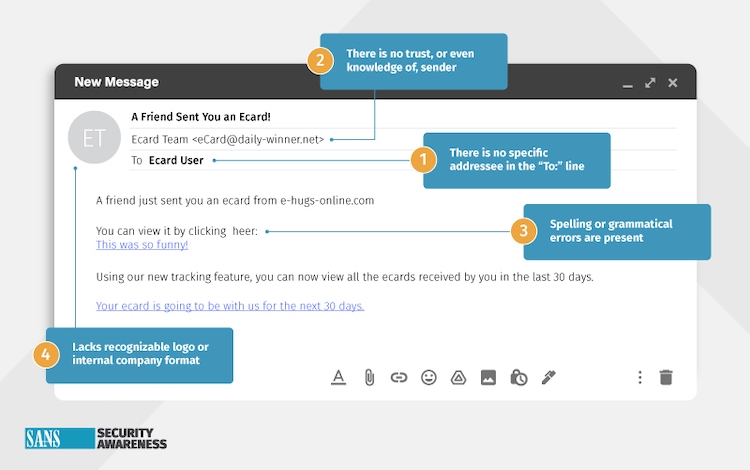
And as you can see by the sample Tier 1 simulation below, the indicators are easy to pinpoint, and should be quickly identifiable by the educated workforce.

Let’s take a look at why tiering is important while benchmarking with external entities, with internal benchmarking and strategies addressed in a future series episode.
Benchmarking, as discussed in the initial blog, is often easier said than done since so many variables impact the validity of the results. Many of these, such as demographics of the workforce or simulation schedule, are easy to identify. Identifying the difficulty of the phish, however, is more problematic to determine since it can be somewhat dependent on vendor tools and how simulations are labeled based on difficulty, if identified at all.
With such a wide range of organizations now utilizing phishing assessments as an awareness tool, we could easily identify similar industries within verticals such as banking/finance. We could also narrow this down by size and even workforce maturity, but typically specifics and similarities on the actual simulation data are hard to compare. The SANS tiering model provides the ability to better “bucket” simulations, ensuring the benchmark data is as viable as possible.
For example, if an organization requires the assessment of their overall security position against a jury of their peers, they could look at historical simulation assessments selecting those that fit the selected tier. When each industry organization shares metrics within the given tier, the metrics are far more impactful than metrics across all tiers, or all difficulty levels.
The ideal situation involves collaboration with like industries and similar cyber security programs; sending the identical simulation, to a represented sample size. If the workforce demographics are comparable, the UAR (Undesired Action Rate), along with the rate of employees reporting the phish, will provide a trustworthy, actionable, benchmark if indicated.
Communication and cooperation across the external entities is crucial, which may be difficult based on the typical workload of the Security Awareness Officer and operational teams. Carving out the time and resources to execute, along with strategic priorities, could drive the team(s) to rely on historical analytics with tiering considerations. In this situation, the teams could rely on bucketing the simulations in a like tier, reducing the resource and scheduling impact.
Cheryl Conley is a phishing and security awareness SME, with the CISSP (Certified Information Systems Security Professional) and SSAP (SANS Security Awareness Professional (SSAP) certifications, along with a Master’s degree specializing in Information Security.
Read more about Cheryl Conley