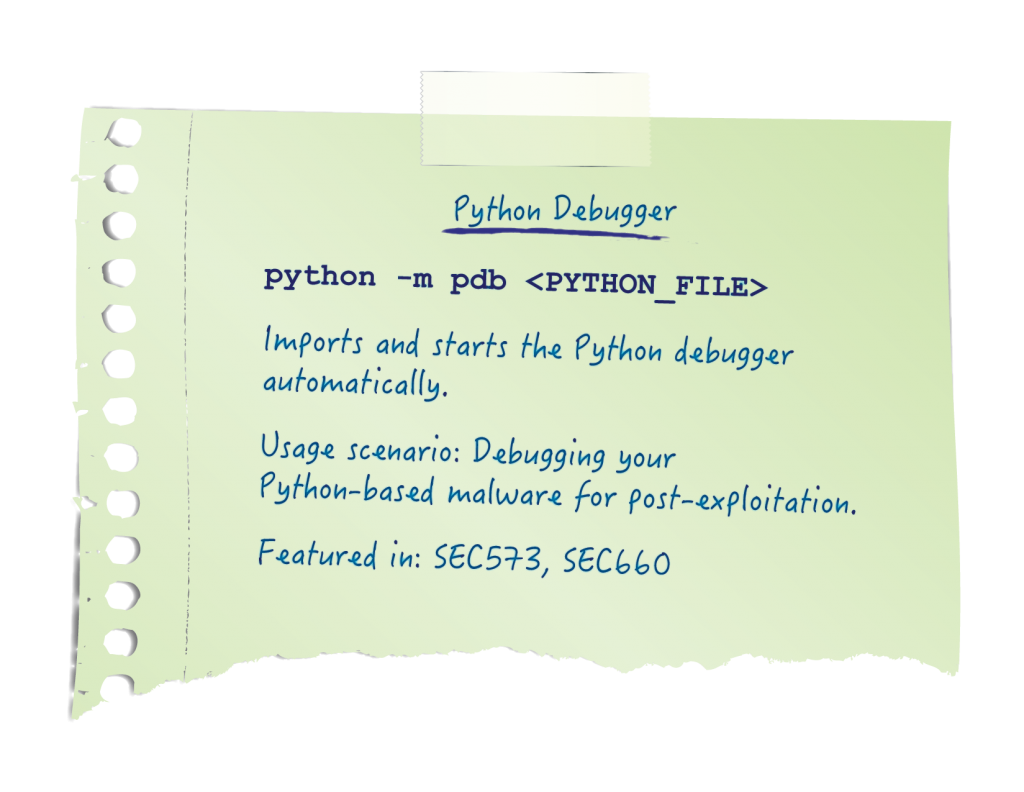
I realize that this may not apply to many of the super awesome reader of the SANS blogs, but when mere mortals develop tools the first few versions often have bugs in the code. Python has a very nice debugger that is part of the standard installation called PDB. PDB, aka The Python Debugger is a built in module that you can use to execute Python scripts one line at a time and inspect the state of the program as it runs. Even our awesome readers who write error free code every time can benefit from using the Python debugger. I'll often use the debugger to look at other people's code. Whether inspecting Python based malware or getting a better understanding of the techniques being used by Python based tools that other people have written, everyone can benefit from using PDB.
There are two ways that you will typically start the Python debugger. One way is to edit the Python script and add the line "import pdb;pdb.set_trace()" in the script at the point you would like to debug the program. Then start your program with the normal invocation. When the new pdb line is reached during the programs execution, it will pause your program and launch the debugger. Another way to start the debugger is to add the command line argument "-m pdb" when executing Python. For example, executing "python -m pdb myscript.py" will start the Python Debugger and load myscript.py paused on the first line of the program. When the debugger starts your prompt changes from the normal >>> interactive python prompt to (Pdb).

Here on line 1 (inside the blue box) we invoke the Python Debugger and tell it to start debugging a program called "debugme.py". The debugger starts and prints a "status line" on line 2 (inside the red box). The status line tells us on which file, line and function the debugger stopped. In this example you can see the full path to the script that the debugger is in. You can also see it stopped on line 2 which appears in the parenthesis. Then the name of the function that is currently executing is also displayed. In this case we are not in a function yet so "<module>" is displayed. The next line (in green) is the line of code that is about to execute. In this case line 2 of the script contains "import random" and that is what will execute when the program starts. On the next line is the (Pdb) prompt where we can enter PDB commands to interact with our code. In the example above typing "L 5,10" listed lines 5 through 10 of the program. I've included a table below of some of the most commonly used PDB command and what they do. Here is one other example. You could create a breakpoint which will cause the debugger to pause execution any time a specified line is reached by typing "Break" followed by the line number on which you want to pause. For example, here we create a breakpoint on line 6.

Notice that when we list our program now a capital B is displayed on line 6 indicating that a breakpoint is present in our program. Now when "c" (short for continue) is typed the program will execute until line 6 or the end of the program is reached.
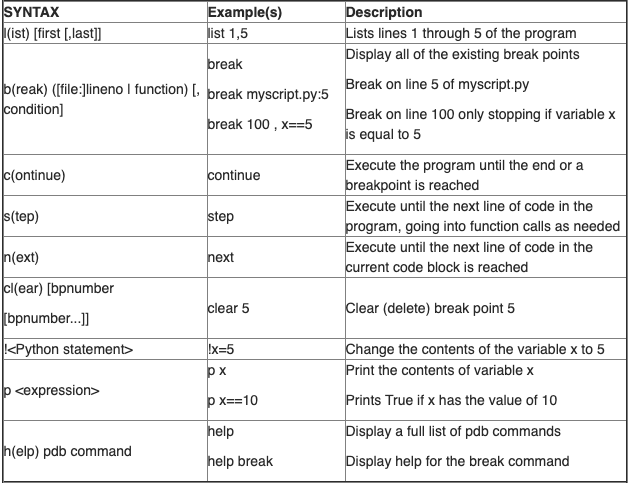
PDB is a full featured debugger that will allow you to set break points, inspect variables and change them. You can execute code one line at a time choosing to either "STEP INTO" function calls or "STEP OVER" them. With full control of the execution of your code, it making the task of finding those pesky bugs or understanding the payload of that malware much easier. The following chart contains just a few of the command you can enter at the (Pdb)prompt.

For more details on PDB and to really understand how to use it check out SANS "SEC573: Automating Information Security with Python." Python SEC573 teaches Defenders, Forensics and Penetration Testers essential skills for automating tasks that make you more effective in your job. No matter which side of the security equation you are on this course can make you more effective.


