System scanner (available from CodeProject) is designed as a replacement to the Task manager. For the forensic or incident handling professional, this tool allows for the dumping of virtual memory at a point in time on a Windows system.

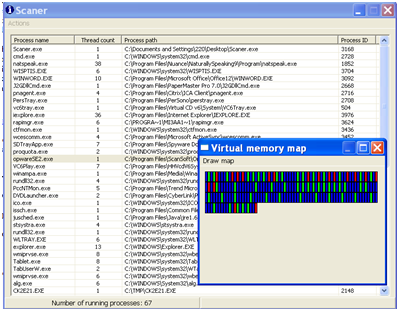
The Windows task manager lacks the ability to fetch more specific info about the processes that is supplied using the System Scanner (such as the IDs of all the threads, handles to DLLs, ability to suspend specific threads of a specific process and, finally, an ability to view a process' virtual memory map — see figure 1).
- When a program is started, you are shown the main window which shows all the currently running processes in your system, the number of threads per process and the executable path. The status bar will show you the overall number of running processes. The list will be updated (by default) every 5000 milliseconds. Pressing Enter will force the update of the list.
- From the main menu it is possible to force an update of the process list and enter Options where you can customize the refresh time, turn hot track on\off (on by default) and customize the colors of the memory regions in the virtual memory map.
- Right-clicking on any of the processes brings up a context menu which will uncover all the features of the program. This uncovers information about the process' threads, DLLs, virtual memory, set process' priority and offers a kill process function.
One of the best parts of this and other CodeProject listings is that the source code is available for the Windows application. This allows you to update the application as needed. The System Scanner was designed for Windows 2000, but it is portable to newer versions (e.g. Vista) with little effort. Having been developed using the .Net framework and using Visual Studio 2003, the application can be easily imported into Visual Studio 2008 and updated for either Windows Vista or Windows 7.0 (beta) use.
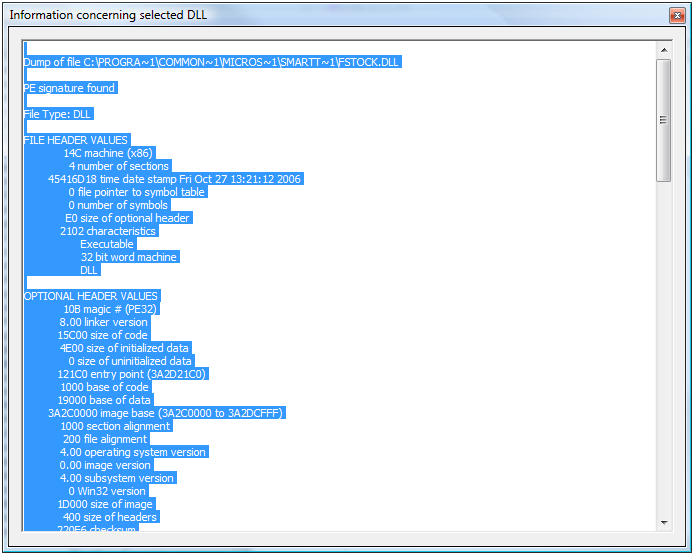
System Scanner allows an Incident responder or forensic analyst to view the DLLs loaded in Virtual Memory. This is as simple as being able to list the the general information (path, handle, size, base address) about the DLL or even more complex tasks such as disassembly. Using other code segments on the CodeProject site (DUMPBIN.EXE, LINK.EXE, MSDIS110.DLL, MSPDB60.DLL and mspdb71.dll), you can selectively disassemble DLLs and EXEs on a live system.

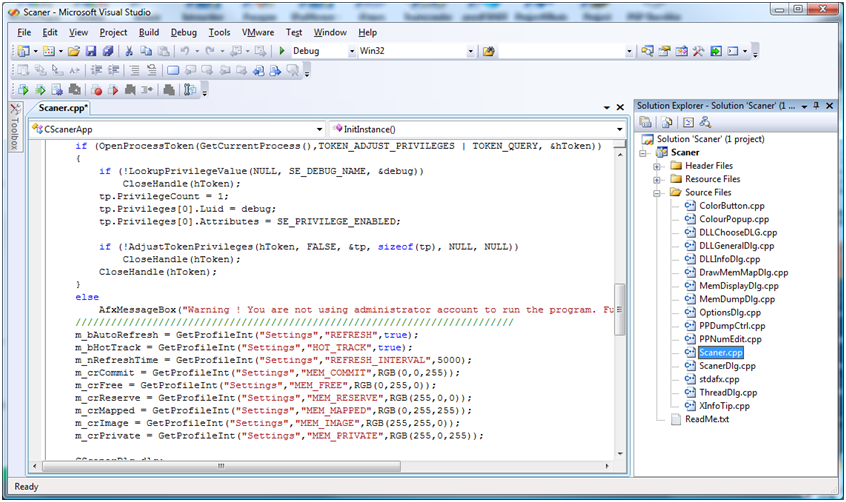
Importing the code into Visual Studio 2008 is a simple process (see Figure 2). From here, you can rebuild the application with full access to the Windows Vista memory map.

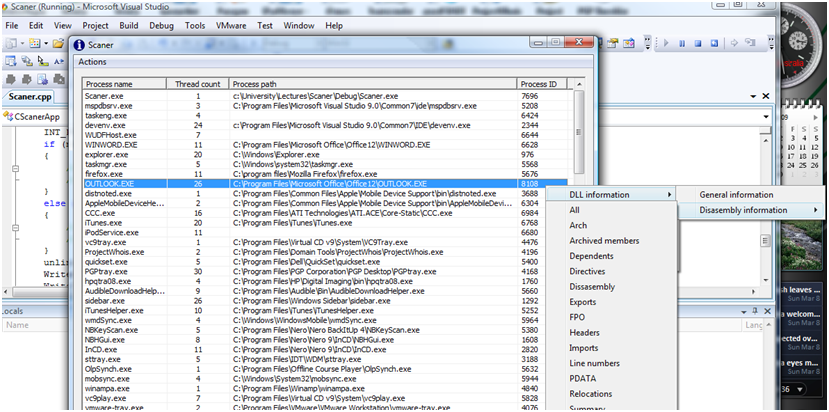
Figure 4 displays the process used to disassemble a DLL on a live system using the System Scanner.

As the source code is available, you can validate it to ensure that there are no hidden got-ya's that you can find in compiled applications. More importantly, you can recompile the code with your own changes. This can be updating the application to run on newer versions of Windows or to add additional functionality into the code.
People often state that there are few means of accessing code and memory directly on Vista or other systems. The answer is at hand. Compile a little code for the system you are working on and away you go. All the hard work has already been done for you.
Craig Wright is a Director with Information Defense in Australia. He holds both the GSE-Malware and GSE-Compliance certifications from GIAC. He is a perpetual student with numerous post graduate degrees including an LLM specializing in international commercial law and ecommerce law as well as working on his 4th IT focused Masters degree (Masters in System Development) from Charles Stuart University where he is helping to launch a Masters degree in digital forensics. He starts his second doctorate, a PhD on the quantification of information system risk at CSU in April this year.


