System snapshots are a core component when conducting forensic analysis on a live machine. They provide critical insight into what was going on at the time they were taken, but this is also their limitation: your view is limited to a precise moment in time, without context and the opportunity to observe changes as they occur.
Take an example of malware analysis - you've executed a malicious process within a virtual machine and run strings against the process memory. This can be exceptionally useful at obtaining information such as IP addresses and configuration information, but what if the sample hasn't had the chance to contact it's C2 server yet? You may not get the information you desire at the precise moment you execute the strings command.
Whilst considering options on how to expand on the snapshot and monitor system changes in real time, I experimented with several ideas including development of a system driver, or using Kernel Tracing, all of which were fairly complex, when it struck me - a snapshot is like a picture, and if you put together enough pictures, one after another and play them quickly, you end up with a film!
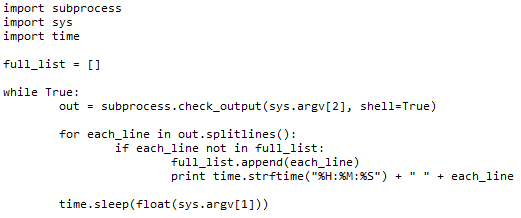
Eight lines of Python later I developed a proof of concept which works pretty well. It was designed to be flexible enough to allow the user to decide what snapshot tool was to be monitored, and the frequency to do so. Every iteration, it gathers the output from the executed subprocess and compares it against an array of previously observed results. If there is something new, that hasn't been seen before, it displays it to the user along with a timestamp, and then adds it to the array to prevent future duplication.

Let's play through an example. In the image below I have decided to dump the strings from process id 5284, which is a browser. I am piping the output into grep and only interested in strings that contain the phrase 'cyberkramer'. When the script starts it will do a first pass against the process memory and store all the results it finds that meet the criteria into an array within the script. A second later, it will re run the process strings dump - as it has seen the same strings previously, they will not be displayed again. However, if I then typed cyberkramer_writes_code into the URL bar, it will find a new string in memory and display it to me along with the timestamp at which it was found.

Another example to demonstrate the flexibility of script is to run it against netstat. In this case I am only interested in results that contain "123". When the script was first run at 12:39:38 I was presented with two lines ending * : *, at this point the script had stored the baseline values. I then loaded a browser a visited 1.2.3.4:123, and at 12:40:11 the script detected the new line output by netstat during that iteration, and it was presented it to me.

Tools such as Process Monitor can assist with monitoring for operating system changes, but here are a few examples of utilities not covered by traditional behavioural monitoring tools which it may be useful to try with:
- Volatility framework modules
- Modifications to autoruns (using sysinternals autoruns)
- Process memory strings (try narrowing by regex grepping for IP addresses or domains)
The source code is available from my github repo - please feel free to fork and alter to suit your needs.
I would be very interested to hear your feedback and hope this is of some use to you. It can be used against any program which produces results via the command line, and maybe especially useful for malware specialists conducting behavioral analysis.
Happy reversing!


